The link building KPIs worth tracking fall into three layers: delivery (did each order go live as ordered, on time and at the planned cost), survival (is each link still live and counting months later) and outcome (did the target pages gain clicks and rankings). Agencies get into trouble when they promise outcome numbers they do not control and skip the delivery numbers they do.
This guide gives each KPI a formula, the data source that answers it, a working target and a review cadence. It ends with a KPI sheet you can send to a client and a worked example of one quarter's numbers for a 30-link campaign.
The three layers of link building KPIs
A KPI is only useful if someone can act on it when it goes wrong. That depends on two things: how quickly the number responds to your work, and how much of it you control. Live rate responds within days and is entirely yours. Organic clicks to a target page respond over months and also move with content quality, competitors and Google's updates. Treat those two numbers the same way in a contract and you end up either overpromising or underreporting.
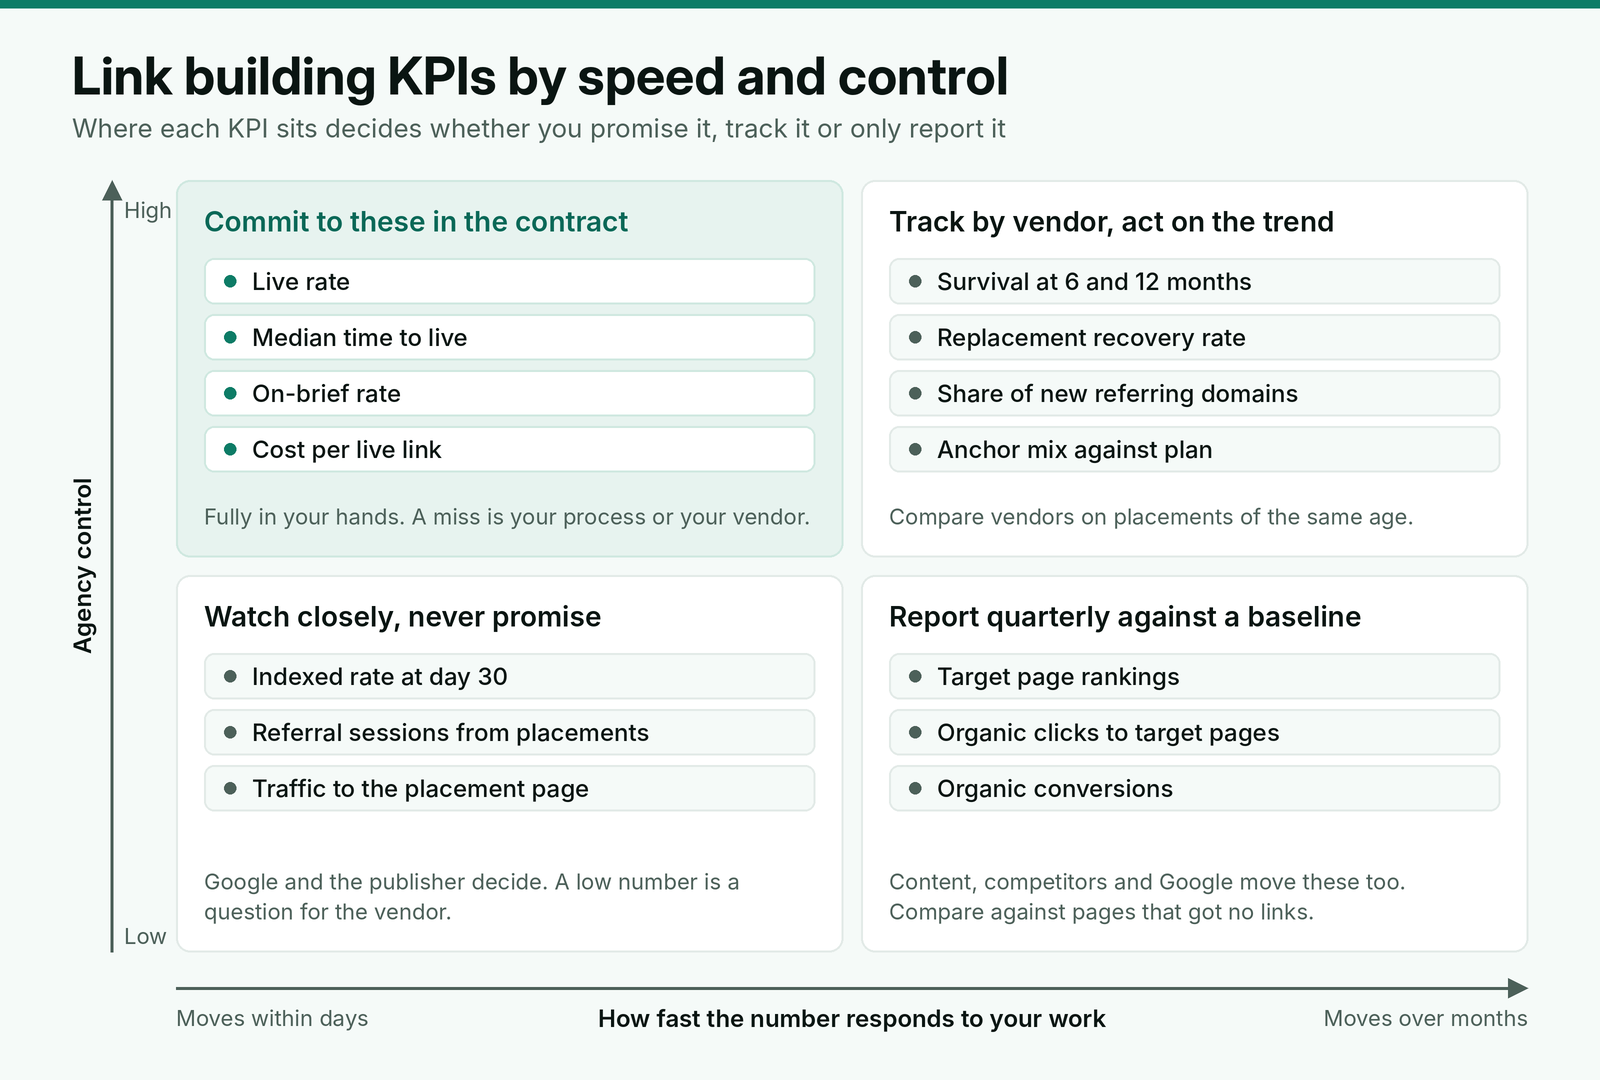
We run every campaign on that split. Delivery KPIs go in the proposal and the contract with numeric targets. Survival KPIs are tracked per vendor and decide who gets next quarter's orders. Outcome KPIs are reported to the client against a baseline taken before the first link, never promised as a number.
Delivery KPIs: from order to live link
These come straight from your order log, so they are the most reliable numbers you have. Count them over a fixed period, such as a calendar month, using the date the order was placed. If that log is still a spreadsheet, our comparison of tools that keep every link order on one record covers the options.
Live rate
Formula: live, on-brief links divided by links ordered in the period, measured once the vendor's quoted turnaround has passed for every order in it.
Working target: 90% or more. A placement that is still "in progress" a week after its quoted turnaround counts as a miss for that month, even if it lands later. Without that rule, live rate drifts toward 100% on paper while the client waits.
Median time to live
Formula: days from order placed to link verified live, as a median rather than an average, so one 60-day straggler does not distort nine 15-day orders.
Working target: a median inside the vendor's quoted turnaround, with any single order past twice the quote flagged in the weekly review. Record this by vendor and by link type, because guest posts that need a new article take longer than niche edits on existing pages.
On-brief rate
Formula: links that match the order on first check (target URL, anchor, rel value, placement in the article body, indexable page) divided by links that went live.
Working target: 95% or more. Below 90% means either the brief is unclear or the vendor is not reading it, and both are fixable within a month. Count the link as off brief even if the vendor corrects it the next day: the KPI measures how often you have to chase.
Cost per live link
Formula: everything spent on placements in the period, including orders paid up front that have not gone live yet, divided by live, on-brief links delivered in the period.
Working target: within 10% of the planned average price. Cost per live link is not the same as the price on the quote. It rises when orders stall, get rejected after payment or need a free replacement that eats team time, and it is the number that tells you whether the campaign's margin is holding.
Survival and quality KPIs: is the link still counting?
A link that went live in March and was quietly removed in June still shows as delivered in March's report. Survival KPIs catch that. They need a crawl of every placement URL, which is why we pair them with a monthly recheck of every placement rather than an SEO tool's lost links report.
Indexed rate at day 30
Formula: placement pages that are in Google's index 30 days after going live, divided by placements that have been live for 30 days or more.
Working target: 90% or more. If one vendor's placements fall below 80%, pause orders with that vendor until it explains why. Pages that stay out of the index usually sit on sites Google has stopped trusting, or on sections a publisher keeps for paid posts.
One practical limit: you cannot run the check in your own Search Console, because the URL Inspection tool only accepts addresses in the currently opened property, and the publisher's site is not yours. Use a site: search on the exact URL or an SEO tool's index check, and log the result on the order.
Survival rate by placement age
Formula: placements still live and matching the order, divided by all placements of the same age, reported at 6 months and at 12 months.
Age matters more than most reports admit. When Pew Research Center tested a sample of just under 1 million pages collected between 2013 and 2023, it found a quarter of them were no longer accessible, and the share rose steeply with age.
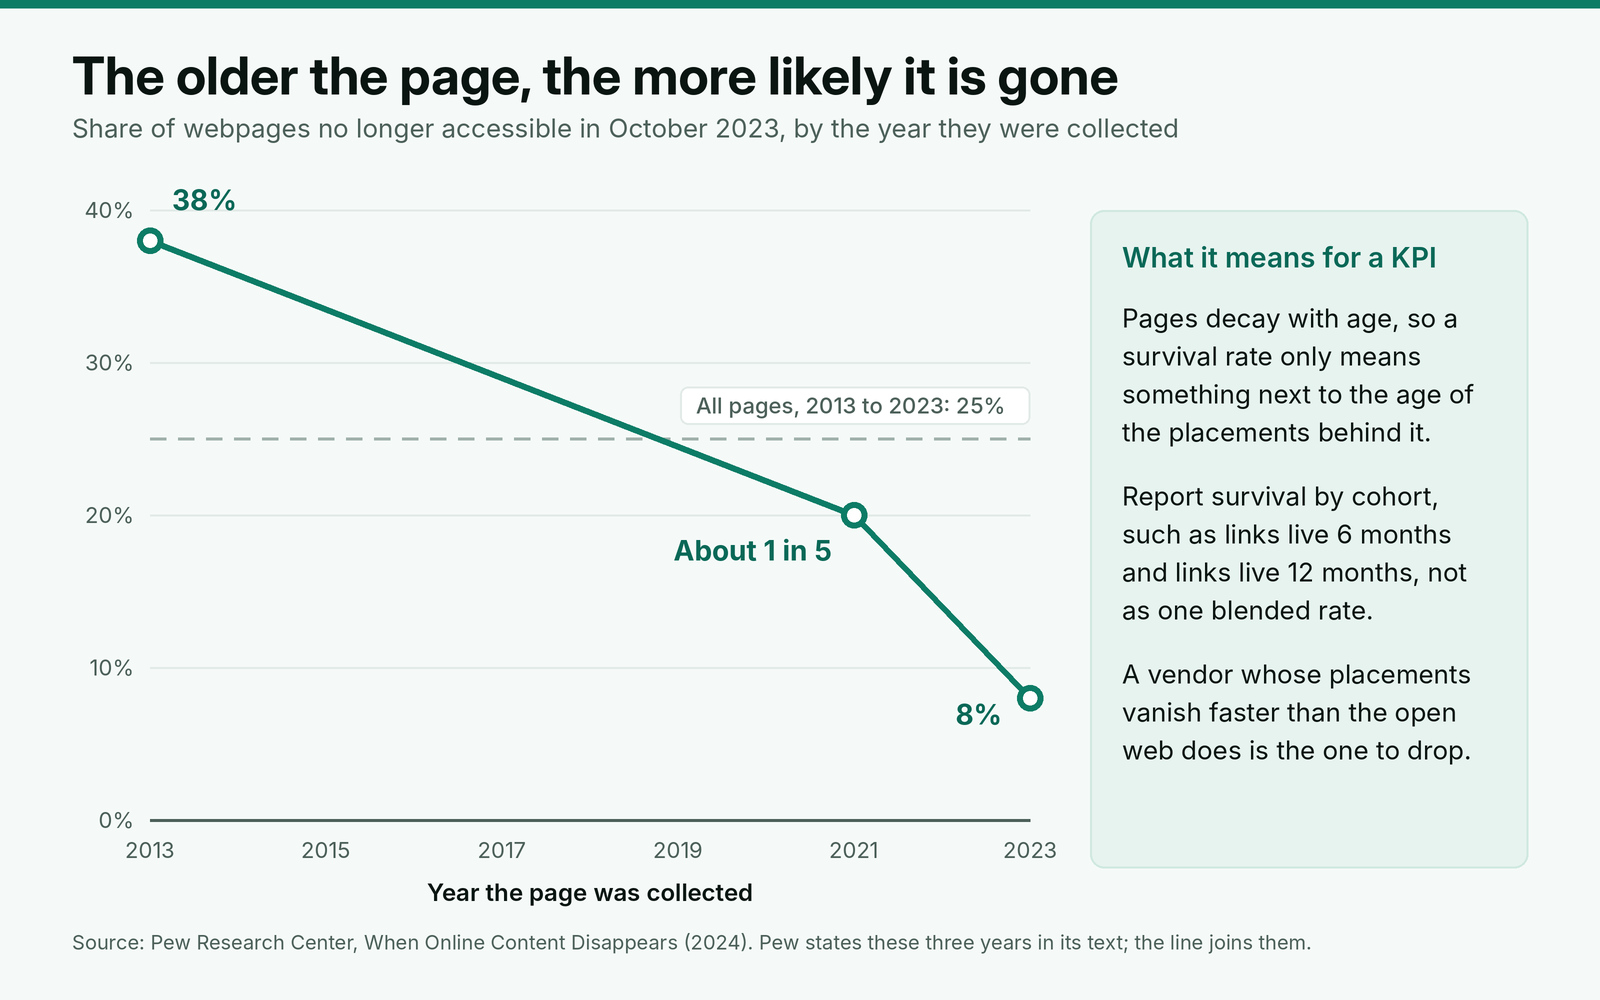
So report survival by cohort, and compare vendors on placements of the same age. Paid placements on vetted, maintained sites should beat the open web: if 2023's pages were already 8% gone within months, a vendor losing more than 1 in 10 of its placements inside the first six months is doing worse than ordinary web pages, on sites that were supposed to be better than ordinary. That vendor's share of orders should shrink.
Replacement recovery rate
Formula: lost placements restored or replaced by the vendor, divided by lost placements that were inside their replacement window when you found them.
Working target: 100% of in-window claims resolved within 30 days. The denominator is the point: a loss you found after the window closed counts against your monitoring, not the vendor.
Share of new referring domains
Formula: links delivered in the period from domains that had never linked to the client before, divided by all links delivered in the period.
Working target: 80% or more, unless the plan deliberately adds a second link from a strong site. A second link from a site that already links to the client adds less than a first link from a new site, and a vendor that keeps reusing the same domains is often selling from a small network. Check this against the baseline export from the onboarding checklist, which is your record of who linked before you started.
Anchor mix against plan
Formula: the share of delivered links in each anchor type (branded, URL, generic, partial match, exact match) compared with the shares the plan set for the quarter.
This is a drift check rather than a target. If the plan called for a small share of exact match anchors and the delivered links are running at double that, the next month's orders should correct it before the profile looks built.
Outcome KPIs: what the client is paying for
Outcome KPIs are the reason the client buys links, and the ones you control least. Google's own starter guide says some changes take effect in a few hours, others could take several months, and suggests waiting a few weeks before judging whether a change helped. Links behave the same way, so read outcome KPIs quarterly and never on the week a link goes live.
- Organic clicks to target pages: from the Search Console Performance report filtered to the pages you built links to, compared with the same period before the campaign.
- Rankings for a fixed keyword set: agree 20 to 50 keywords per client at onboarding and track the median position, not the best one.
- Referral sessions from placements: from your analytics, filtered to the referring domains in your order log. Most placements send little traffic, and the few that do are worth more orders.
- Organic conversions on target pages: only where the client's tracking is reliable enough to trust.
Report every outcome number next to a comparison group: similar pages on the client's site that got no new links in the same period. If the linked pages gained 30% more clicks and the unlinked pages gained 25%, the links did far less than the headline suggests, and the client will work that out eventually.
Two quality checks belong beside these numbers rather than in them. Relevance and the page-level strength of the page carrying the link decide how much a placement can move a target page, so a weak quarter of outcome numbers usually traces back to placement choices, not to link count.
Where each KPI's number comes from
Every KPI needs a source that is complete enough to trust. The order log is the only complete record of what you bought; everything else is a sample or a view with limits.
| KPI | Source | Limit to know |
|---|---|---|
| Live rate, time to live, on-brief rate, cost per live link | Your order log, plus a check of each placement when it goes live | Complete only if every order, including rejected ones, is logged |
| Indexed rate at day 30 | site: search or an SEO tool's index check on each placement URL | URL Inspection in Search Console only accepts URLs in your own property |
| Survival rate, replacement recovery | A monthly crawl of every live URL in the order log | Must check rel value, noindex and canonical, not only whether the link exists |
| Count of sites linking to the client | Search Console Links report, as a cross-check only | A sample, with tables limited to 1,000 rows; includes links that may have since been removed and does not say whether a link is nofollow |
| Referral sessions, organic conversions | Your analytics, filtered to placement domains and target pages | In Google Analytics, user-level and key event data is kept for 2 months or 14 months, depending on the property setting |
| Organic clicks, rankings of target pages | Search Console Performance report, filtered to target pages | Export a baseline before the first link goes live |
Check the analytics retention setting on day one. On the 2-month setting, a quarter-over-quarter comparison of referral conversions from explorations is impossible by the time you need it.
Metrics to drop or demote
Total backlinks. One sitewide footer link can add thousands. Report referring domains gained instead, and only from your own log.
The client's authority score as a goal. Third-party scores such as Domain Rating are useful for vetting a site before you buy, but a client's own score is a side effect of the campaign, not its purpose. A campaign can raise it without moving a single target page.
Average authority of placements. An average of 60 can hide three placements on sites with no organic traffic. Report the share of placements that met the client's written site standard instead.
Links shown in Search Console. The report is a sample, and Google's John Mueller said on October 29, 2026, when asked about links missing from it: "I wouldn't anchor on whether Search Console shows them." A placement missing from the report is not proof the link failed, and one listed there is not proof it still exists.
A KPI sheet to agree with the client
Send this with the proposal or at kickoff, so the client signs off on the definitions before the first report arrives. Change the targets to fit the plan, but keep the formulas: arguments about results are usually arguments about what was being counted. If you are still drafting the offer, put the delivery targets in your proposal so they carry into the contract.
Link building KPIs for [client name], [quarter]
Delivery (reported monthly, committed)
Live rate: live, on-brief links divided by links ordered. Target [90]% within the quoted turnaround.
Median time to live: days from order to verified live link. Target [21] days or less.
On-brief rate: links matching target URL, anchor, rel value and placement on first check. Target [95]%.
Cost per live link: placement spend divided by live, on-brief links. Target within [10]% of [$ planned average].
Survival (reported monthly, tracked by vendor)
Indexed rate at day 30. Target [90]%.
Survival at 6 and 12 months, by placement age.
Replacement claims resolved within 30 days. Target 100% of in-window claims.
Share of links from new referring domains. Target [80]%.
Outcome (reported quarterly, not guaranteed)
Organic clicks to [number] target pages, against the baseline of [dates] and against [number] comparison pages without new links.
Median position for [number] agreed keywords.
Referral sessions and organic conversions from placements, where tracking allows.
Sources: our order log and monthly placement crawl, Search Console and [analytics tool]. Baseline exported on [date].
Worked example: one quarter for a 30-link campaign
Here is a made-up example. An agency ordered 30 links for a B2B software client in one quarter, through two vendors, at a planned average of $380 per link, all paid when ordered. Total spend: $11,400. Eight target pages and 40 tracked keywords were agreed at onboarding, with six similar pages left without new links as a comparison group.
| KPI | Result | Target | Read |
|---|---|---|---|
| Live rate | 27 of 30 (90%) | 90% | On target; three orders still in progress |
| Median time to live | 18 days | 21 days | On target; one order at 44 days, past twice its 21-day quote |
| On-brief rate | 25 of 27 (93%) | 95% | Miss; two wrong anchors, both from one vendor, fixed within a week |
| Cost per live link | $11,400 / 27 = $422 | $380 to $418 | Miss; falls to $380 if the three open orders land on brief |
| Indexed at day 30 | 19 of 21 eligible (90%) | 90% | On target |
| Lost and recovered | 1 lost, 1 replaced | 100% in window | On target |
| New referring domains | 24 of 27 (89%) | 80% | On target |
| Organic clicks to target pages | +31% on the prior quarter | Reported, not promised | Comparison pages +4% in the same period |
| Median position, 40 keywords | 17 to 12 | Reported, not promised | Comparison keywords 21 to 20 |
Two misses and both are useful. The on-brief miss points at one vendor's process, and the fix is a one-line change to its brief plus a check of its next five orders before payment. The cost per live link miss is timing, not price: $1,140 is sitting in three paid orders that have not landed. If they are still open at the next turnaround date, that money becomes a claim, not a forecast.
The outcome rows carry the story the client cares about, and the comparison group is what makes it believable. Linked pages gained 31% in clicks while similar unlinked pages gained 4%, so most of the lift is plausibly the campaign rather than seasonality. For how to lay these rows out for the client, see the monthly report layout we use to show these numbers.
How often to review each KPI
Weekly, look at orders past their quoted turnaround and any link that failed its first check. That is a 15-minute review, and it is where most delivery misses get fixed before they show up in a report. Monthly, calculate the delivery KPIs, run the placement crawl and update survival and indexing. Quarterly, read the outcome KPIs against the baseline and the comparison group, and rebalance orders between vendors using their survival and on-brief numbers.
Keep the definitions fixed for at least a quarter. Changing how live rate is counted mid-campaign makes every earlier month impossible to compare.
Where BuildLinks fits
Delivery KPIs are counts and averages over your order book, so they are only as good as the order record behind them. That is the record we built BuildLinks to keep. In BuildLinks, each order moves through Pending, In Progress, Completed and Rejected, and guest posts and niche edits are rechecked automatically the moment the link publishes, so Completed means the link was verified live rather than reported live.
The reports view gives you total spend, average cost and average turnaround for any date range, with a status breakdown and a guest post versus niche edit split, scoped to what each role is allowed to see. Divide spend by completed orders for cost per live link, and read live rate from the status breakdown. Indexing, survival after the first check, rankings and clicks come from your own monthly crawl and Search Console.
Conclusion
Split your link building KPIs by what you control. Commit to delivery numbers in writing: a live rate of 90% within the quoted turnaround, a median time to live inside the quote, 95% of links on brief and cost per live link within 10% of plan. Track survival and indexing by vendor and by placement age, and move orders away from any vendor whose links vanish faster than ordinary web pages do.
Report clicks and rankings quarterly, always against a pre-campaign baseline and a set of pages that got no links. Agree the definitions with the client before the first report, and keep them fixed for the quarter.