A link building report template that clients read has six sections: a three-line summary, delivery against plan, a placement log, quality and risk, outcomes, and next month. Most of the templates that rank for this search are built around Domain Rating, rankings and backlink totals, and only 40% of link builders in a 2025 industry survey say their reports effectively show value.
This guide gives you the full template: every field in the placement log and where its data comes from, a worked example for a twelve-link month, the summary email that goes with it, and the numbers to leave out. It is written for agencies and freelancers who deliver placements to clients, so the report is built around what was ordered, what went live and what it cost, with outcomes reported separately on the timeline they deserve.
What the data says about link building reports
Two surveys cover how link builders report, and they agree on the problem: teams track plenty, but the report rarely connects it to anything the client cares about.
| Finding | Share of respondents | Source |
|---|---|---|
| Say their link building reports effectively show value | 40% | Industry link building survey, published April 13, 2025, updated April 17, 2025 |
| Say their reports are easy to understand | 53% | |
| Judge a published link by the target page's organic visibility | 59% | |
| Judge it by revenue from organic visits | 28% | |
| Are given 6 months or fewer to prove value | 75% | |
| Include new backlinks in their reports | 76.92% | Databox survey of 65 link builders, published May 10, 2022, updated April 10, 2025 |
| Include average link quality | 72.31% | |
| Include outreach response rate | 58.46% |
Read the two together and the gap is clear. Almost everyone reports link counts, most judge success by the target page's visibility, and the 75% with six months or less to prove value are handing clients a report that measures activity while the result is still months away. A good report separates the two: delivery you can prove this month, and outcomes you track as a trend.
The link building report template: six sections
Each section answers one question the client would otherwise email you about. Keep them in this order so the client reads what you control before what you are still waiting on.
- Summary. Three lines: delivered against plan, anything at risk, and the one decision you need from the client.
- Delivery against plan. Placements ordered, live and verified, in progress and rejected, plus average turnaround and the amount invoiced.
- Placement log. One row per link with the fields in the table below.
- Quality and risk. Indexing, anchor mix against plan, and every lost or changed link with its replacement status.
- Outcomes. Rankings and organic clicks for the target pages, shown as a trend since the campaign started.
- Next month. Planned placements, domains awaiting the client's approval and any inputs you need from them.
Placement log fields (copy these columns)
The placement log is the part of the report a client checks when something looks wrong, so every field needs a source and a date.
| Field | What goes in it | Where it comes from |
|---|---|---|
| Order ID | Your reference for the placement | Your order tracker |
| Date live | The day you verified the link, not the day the vendor said it was live | Your own live check |
| Publishing domain | The root domain the client approved | Order record |
| Live URL | The exact page carrying the link | Live check |
| Target URL | The client page the link points to | Order record |
| Anchor text | The anchor as published, and its type (branded, URL, partial, exact, generic) | Live check against the order |
| Link type | Guest post or niche edit | Order record |
| Rel attribute | Dofollow, sponsored or nofollow, as published | Live check (Search Console does not show it) |
| DR and organic traffic | Both, with the date checked | Your SEO tool on the day of the check |
| Indexed | Yes or no, with the date checked | Search Console URL Inspection or a site search |
| Status | Live, in progress, rejected, lost or replaced | Order tracker |
| Guarantee end date | The last day a replacement is free | Vendor or publisher terms |
Two fields do most of the work. The date-checked column on DR and traffic stops a later argument about whether a site was inside the tier the client paid for. The guarantee end date tells you when to recheck, because a replacement claimed after the window costs you the full fee again.
Delivery and quality fields
Section 2 needs seven numbers: placements planned, ordered, live and verified, in progress, rejected, average turnaround in days from order to verified live, and the amount invoiced this month. Section 4 needs four checks: the share of this month's links that are indexed, the anchor mix against the plan for each target URL, links lost or changed since the last report, and the replacement status of each. If you have not set anchor targets yet, set anchor targets per URL before the first report, or this section has nothing to measure against.
Worked example: a twelve-link month
The client, figures and prices below are illustrative, not a real account. The plan for October is 12 placements: 8 guest posts at $350 each and 4 niche edits at $250 each, priced to the client.
| Delivery against plan | October |
|---|---|
| Placements planned | 12 (8 guest posts, 4 niche edits) |
| Live and verified | 9 (6 guest posts, 3 niche edits) |
| In progress | 2, due November 6 and November 11 |
| Rejected at approval | 1: traffic below the agreed 1,000 visit floor on the check date; replacement domain proposed |
| Average turnaround | 19 days from order to verified live |
| Invoiced this month | 6 x $350 + 3 x $250 = $2,850 for 9 live links, an average of $317 a link |
The quality section is where this month needs a decision. The plan for the client's pricing page allows up to 10% exact-match anchors. Of the 9 live links, 4 use branded anchors (44%), 2 use the bare URL (22%), 2 use partial match (22%) and 1 uses exact match (11%). One link put the mix one point over the cap, so the report says so and commits November's orders to branded and URL anchors until it is back under. A recheck of the 31 links placed since the campaign began finds 30 live and 1 removed; the removed link is inside its 12-month guarantee, so the replacement costs nothing and the report lists it as claimed.
The outcome section compares the last 28 days with the 28 days before the campaign started for each target URL, from Search Console. It is labeled as a trend, and if a ranking moved during a confirmed Google update, the report names the update next to the number.
Monthly summary email (copy this)
Subject: [Client] link building report, October: 9 of 12 live, 1 decision needed
Hi [first name],
October's report is attached. 9 of the 12 planned placements are live and verified, 2 are in progress and due by November 11, and 1 domain was rejected at approval because its traffic fell below the floor we agreed. I have proposed a replacement in the portal.
One thing to flag: the exact-match share on links to your pricing page is at 11% against our 10% cap, so November's placements will use branded and URL anchors. One older link was removed by the publisher and the replacement is covered by the guarantee.
Rankings and clicks for the target pages are in section 5 as a trend since we started. Links usually take months to show up there, so judge that section by direction, not by this month alone.
The one thing I need from you: approve or reject the 3 domains proposed for November by [date].
[Your name]
[Title, agency, URL]
Lead the subject line with the delivery number. A client who reads nothing else still knows whether the month went to plan.
Metrics to put in a link building report, and metrics to leave out
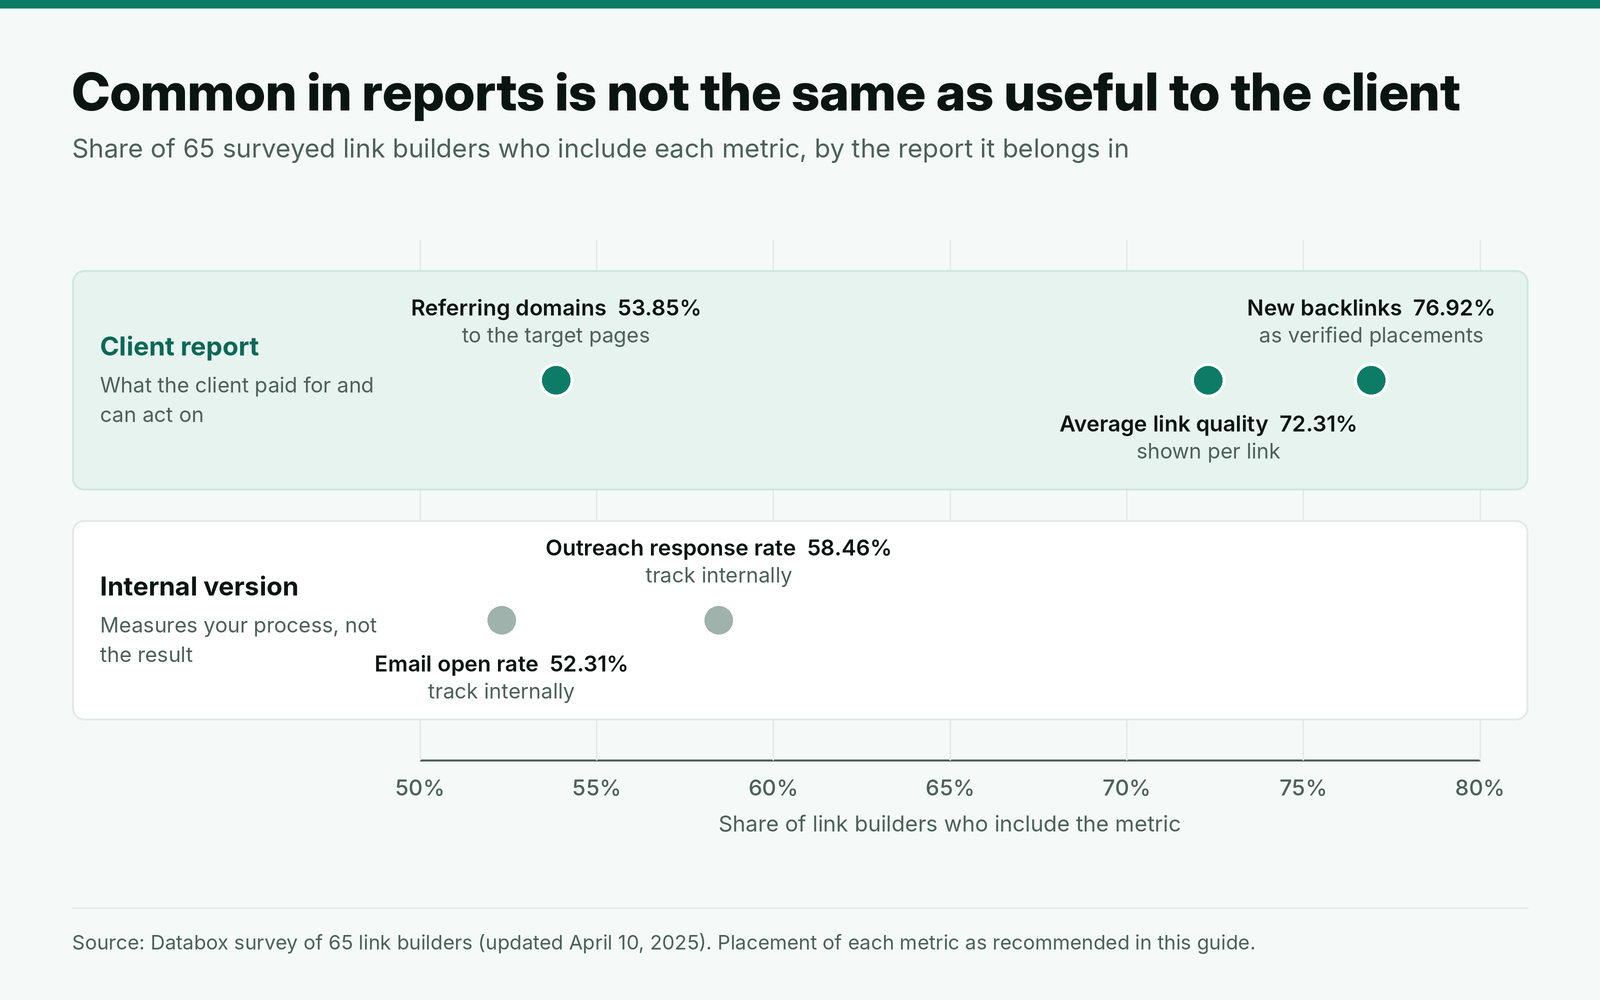
The Databox survey shows what link builders tend to include: new backlinks (76.92%), average link quality (72.31%), outreach response rate (58.46%), referring domains (53.85%) and email open rate (52.31%). Not all of those belong in front of a client.
Keep these in the client report:
- Placements live and verified against plan. The number the client paid for.
- Link quality at placement, shown as DR and organic traffic with the date checked, per link rather than as a single average that hides one weak site.
- New referring domains to the target pages, because ten links from one domain are not ten links.
- Target page visibility and organic clicks, the measure 59% of link builders use to judge a published link, presented as a trend.
Leave these out, or keep them in an internal version:
- Outreach response and open rates. They measure your process, not the client's result. Track them internally.
- The client's own DR as a headline KPI. It moves with factors outside the campaign; here is why DR is a weak headline KPI for a monthly report.
- Vendor cost and vendor name. If you resell placements, the client sees your price only. We list the white label report fields we use in our guide to reselling under your own brand.
- Raw backlink totals from a crawler. They include links you did not build and links that no longer exist, and the client will read every change as your doing.
Where the data in each section comes from
Delivery data comes from your order records, and it is only as good as the live check behind it. A vendor's "live" email is not verification: load the page, confirm the link points to the exact target URL with the agreed anchor and rel attribute, and record the date. The same checks that decide whether a domain is worth buying apply at the report stage; these are the vetting checks we run before approving a domain.
Outcome data comes from Search Console and your rank tracker, and Search Console has limits worth stating in the report. Google's documentation for the Links report says the report is not a comprehensive list of every link, its tables stop at 1,000 rows, and it does not show whether a link is nofollow. Use it to confirm Google has found a link and to see top linking sites, not as the source of truth for what you delivered.
Annotate algorithm updates. Google's September 2026 spam update ran from September 24 to October 8, and Search Engine Roundtable reported that it does not target link spam (October 8, 2026). A client whose rankings moved in that window should see the dates beside the chart, so a drop is not blamed on links placed the same month.
How often to send a link building report
Match the cadence to how fast each number changes.
- Live status, continuously. Order status belongs in a portal or shared tracker the client can check any time, so they never email to ask whether a link is live.
- The full report, monthly. Sections 1 to 4 and 6 change every month, and a monthly report lines up with a monthly invoice.
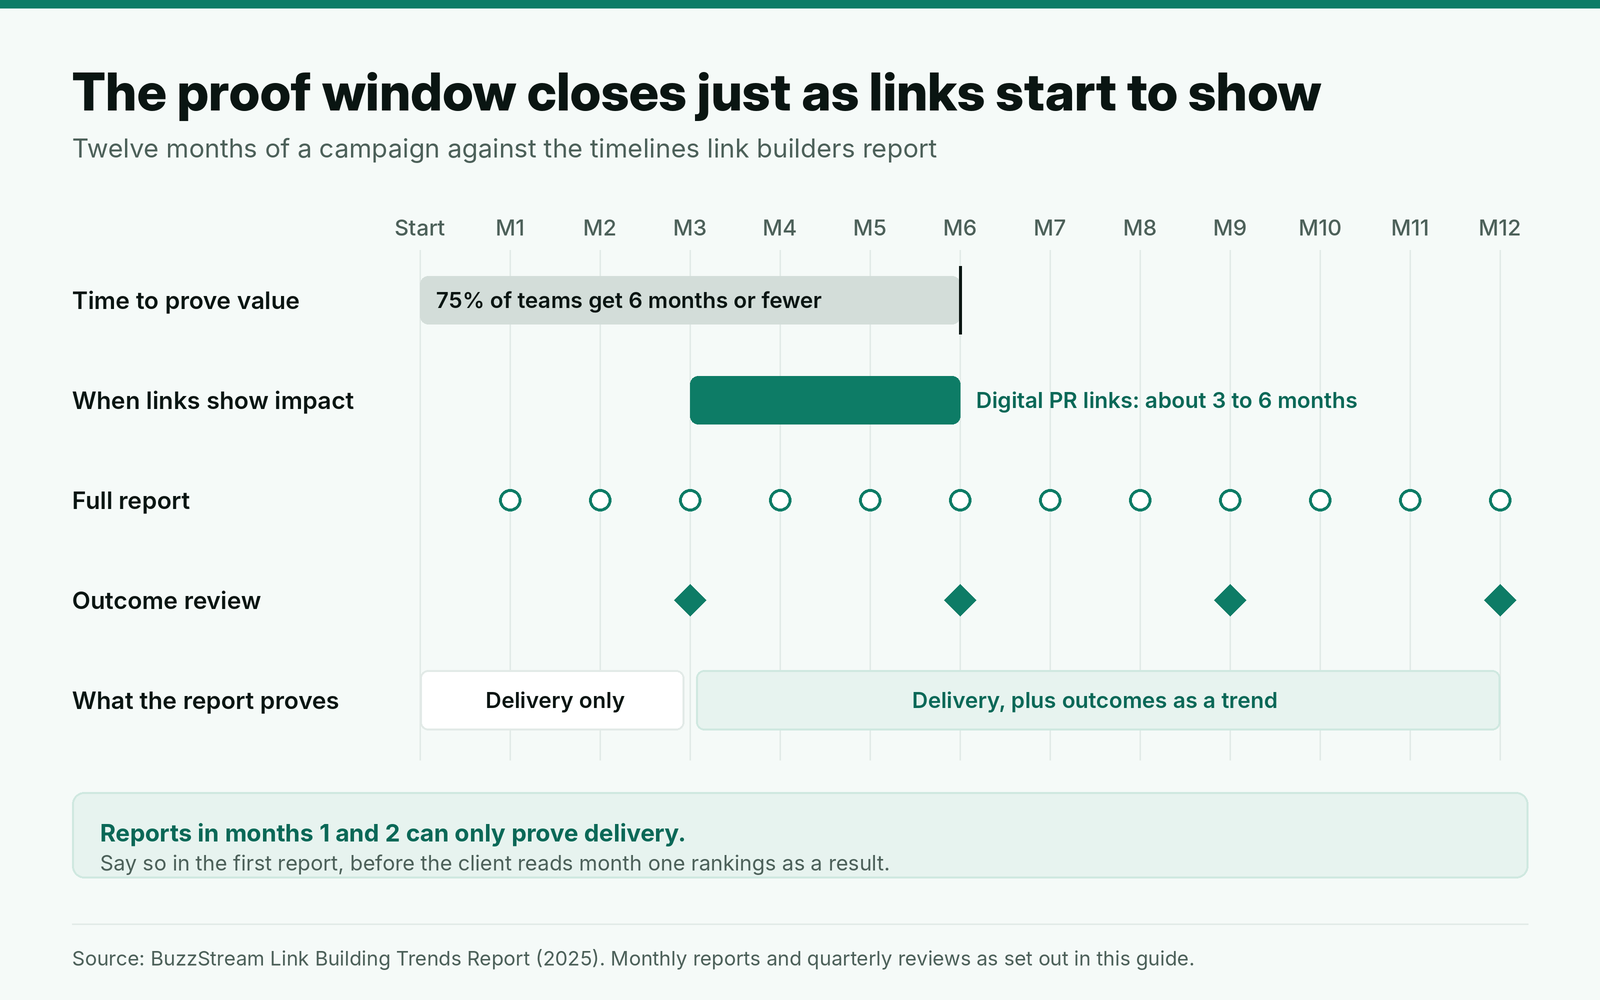
- Outcome review, quarterly. Digital PR links take about 3 to 6 months to show impact, and 60% of teams with leadership support get 3 to 6 months to show value. A quarterly review of section 5 fits that window better than a monthly verdict.
Set that expectation in the first report, before the client starts reading month-one rankings as a result.
Pre-send checklist (copy this)
- Every link marked live was verified by you, with the date in the log.
- DR and traffic for each placement carry the date they were checked.
- The rel attribute for each link comes from your own check, not from Search Console.
- The anchor mix for each target URL is compared with its plan, and any breach is named with the fix.
- Every lost or changed link since the last report is listed with its guarantee end date and replacement status.
- The invoiced amount matches the number of verified live links multiplied by the client's prices.
- Nothing in the report or its file names shows a vendor's name, domain or cost.
- Outcome charts start at the campaign start date and mark any confirmed Google update in the period.
- The summary ends with exactly one decision for the client, with a date.
The invoice line is the one agencies skip and clients notice. If you price by placement, it is also where landed cost per placement meets the client price, so check both before the report goes out.
Where software fits
A report like this takes an afternoon when orders, live checks and invoices sit in three places, and it is the part of the job tools that manage link building orders end to end are meant to absorb. It is also the job we built BuildLinks to do. In BuildLinks, each placement is an order with a status (Pending, In Progress, Completed or Rejected), a guest post or niche edit is rechecked when the link publishes before the order is marked Completed, and the invoice is generated from the completed order. Our reports dashboard shows total spend, average cost, average turnaround, a status breakdown and a guest post versus niche edit split for any date range, scoped to what each role is allowed to see. Clients see their own orders at the price you set, and on the Agency and Custom plans the portal runs on your domain with your logo, so nothing on a report points back to us (see how vendor costs stay on your side of the account). The outcome section still comes from Search Console and your rank tracker.
Conclusion
Build the report in six sections and put delivery first: placements live and verified against plan, average turnaround, the amount invoiced, and a placement log where every metric carries the date it was checked. Report quality as indexing, anchor mix against plan and the replacement status of every lost link, and leave outreach rates, vendor costs and the client's own DR out of the client version.
Treat rankings and clicks as a trend reviewed quarterly, since most teams get six months or less to prove value and links take months to register. Send the full report monthly, end the summary with one decision and a date, and check the invoice line before anything goes out.